
The world's introduction to coworking behemoth WeWork's financials came via its initial public offering filed with the Securities and Exchange Commission last week.
There were a lot of figures to look at behind the company's $47B valuation. The S-1 outlined everything from how many countries WeWork operates in (29) to its overall occupancy rate (90%) to how many of its clients have more than 500 employees (39%).
Depending on how long it has taken you to read the beginning of this article, WeWork may have lost tens of thousands of dollars — since its disclosed operating loss in the first half of 2019 totaled $1.37B, we can break down their burn rate to $5,213 per minute.
What do all of these numbers mean? Are they all important in a market context? How does WeWork stack up to its competitors?
Market data provider Thinknum put together a quick by-the-numbers look at some of the main numbers you may need and Bisnow has added to those with our own charts below.
Among them, how WeWork stacks up to direct competitors IWG (formerly Regus, and denoted that way here) and Industrious; its valuation compared to CRE's biggest players; and how many workspaces each of these companies has. We also wanted to see how WeWork stacks up to the country's largest REIT, Simon Property Group, for a sense of their proportional value.
First, we look at where WeWork has U.S. offices compared to up-and-comer Industrious, which just raised $80M last week and predicts profitability by 2020. Thinknum has done a deep dive on how the two companies are battling for market share and it is worth a read here, but for now we'll just look at where both of them are operating. WeWork dominates in major cities, but Industrious appears to be gaining some ground in the smaller markets:
null
null
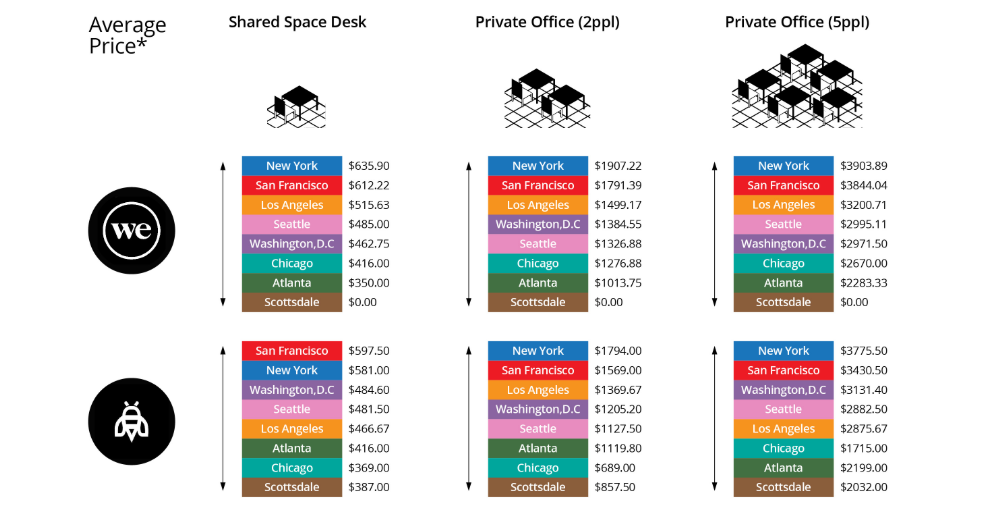
Next, we look at how WeWork compares to Industrious by per-seat price. Because both companies have shared their pricing, we can make both a side-by-side comparison here and a maximum and minimum price comparison:
null
null
Naturally, we are interested in how WeWork, a relatively new company, has grown its footprint compared to IWG/Regus, which has been around for over a decade and is both a public company and profitable. You can see the worldwide presence for both companies below:
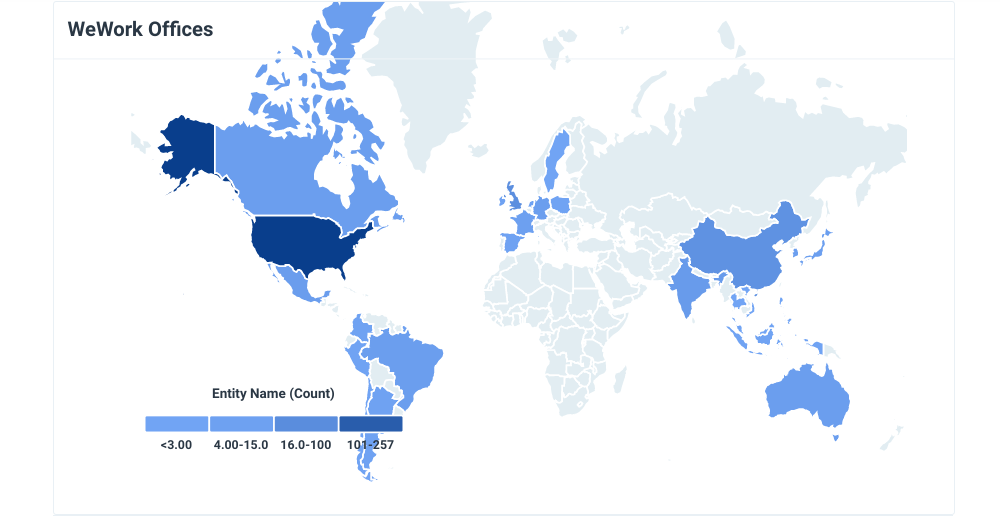
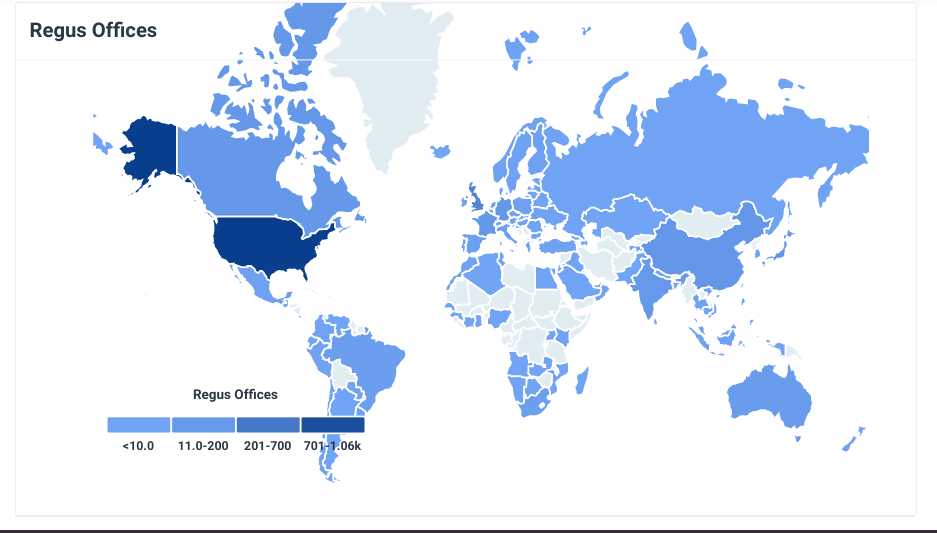
Then, just for fun, we break down how WeWork's much talked about whopper of a valuation stacks up to other major players, including of course, IWG, and Simon Property Group, the most valuable public real estate company, as of their market cap at the close of trade Friday:
)
)
)
)
)
)
)
)
)
)
)
)

